Financial Statement Analysis
- Turnover Ratios
- Inventory Turnover Ratio
- Inventory Ratio
- Accounts Receivable Turnover
- Accounts Receivables Turnover Ratio
- Accounts Payable Turnover Ratio
- Days Inventory Outstanding
- Days in Inventory
- Days Sales Outstanding
- Days Sales Uncollected
- Average Collection Period
- Days Payable Outstanding
- Cash Conversion Cycle
- Cash Conversion Cycle (CCC) Formula
- Activity Ratios
- Fixed Asset Turnover Ratio Formula
- Debtor Days Formula
- Working Capital Turnover Ratio
- Ratio Analysis (17+)
- Liquidity Ratios (29+)
- Profitability Ratios (66+)
- Efficiency Ratios (7+)
- Dividend Ratios (9+)
- Debt Ratios (26+)
Related Courses
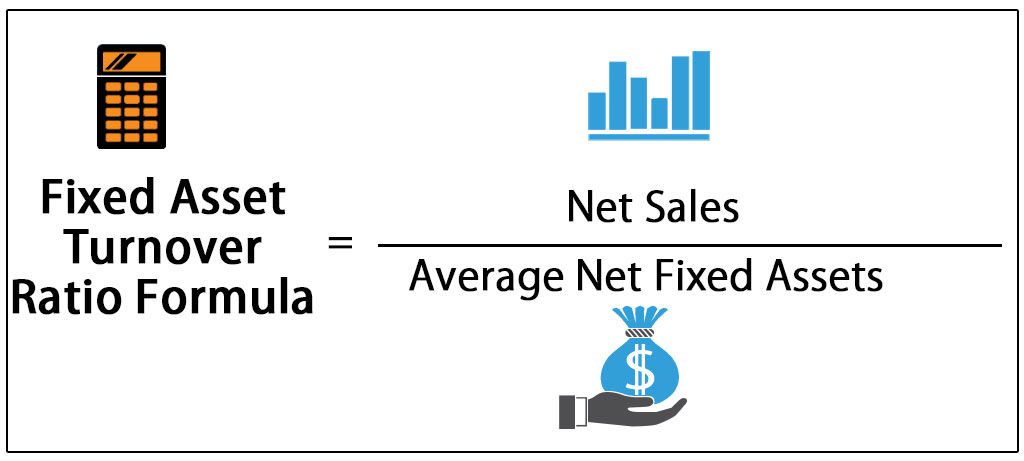
Fixed Asset Turnover Ratio formula is used for measuring the ability of the company to generate the sales using the fixed assets investments and it is calculated by dividing the Net Sales with the Average Fixed Assets.
Table of Contents
- What is Fixed Asset Turnover Ratio Formula?
- Examples of Fixed Asset Turnover Ratio Formula
- Fixed Asset Turnover Ratio Formula Calculator
What is Fixed Asset Turnover Ratio Formula?
The fixed asset turnover ratio formula is a measure of the efficiency of a company and is evaluated as a return on their investment in fixed assets such as property, plant and equipment. In other words, it assesses the ability of a company to efficiently generate net sales from its machines and equipment. The formula for the fixed asset turnover ratio is calculated by dividing net sales by net fixed assets i.e. (gross fixed assets minus accumulated depreciation).
The formula of Fixed Asset Turnover Ratio is represented as,
or
Steps to Calculate Fixed Asset Turnover Ratio Formula
The fixed asset turnover ratio calculation can be simply done by using the following steps:
- Step #1: Firstly, note the net sales of the company which is easily available as a line item in the income statement.
- Step #2: Next, the average net fixed assets can be calculated from the balance sheet by taking the average of opening and closing net fixed assets. On the other hand, gross fixed assets and accumulated depreciation can also be captured from the balance sheet to calculate the net fixed assets by deducting the accumulated depreciation from the gross fixed assets.
- Step #3: Finally, the calculation of the fixed asset turnover ratio is done by dividing the net sales by the net fixed assets as shown below.
Examples of Fixed Asset Turnover Ratio Formula
Let us see some simple to advanced examples of Fixed Asset Turnover Ratio Formula to understand it better.
Fixed Asset Turnover Ratio Formula – Example #1
Let us consider two independent companies X and Y that manufactures office furniture and distribute it to the sellers as well as customers in various regions of the USA. The following information for both the companies is available:

From the above table, the following can be calculated,
Based on the above information calculate the fixed assets turnover ratio for both the companies. Also, compare and determine which company is more efficient in using its fixed assets?
As per the question,
Average net fixed asset for Company X = (Opening net fixed assets + Closing net fixed assets) /2

The average net fixed asset for Company Y=(Opening net fixed assets + Closing net fixed asset)/2

Therefore,
Fixed asset turnover ratio for Company X = Net sales / Average net fixed assets

So, from the above calculation Fixed asset turnover ratio for company X will be:

Fixed asset turnover ratio for Company Y = Net sales / Average net fixed assets

So, from the above calculation Fixed asset turnover ratio for company Y will be:
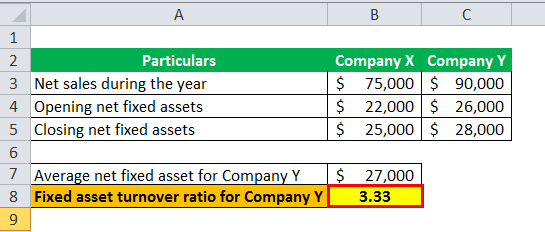
Therefore, company Y generates a sales revenue of $3.34 for each dollar invested in fixed assets as compared to company X which generates a sales revenue of $3.19 for each dollar invested in fixed assets. Based on the above comparison, it can be said that Company Y is slightly more efficient in utilizing its fixed assets.
Fixed Asset Turnover Ratio Formula – Example #2
Let us take the example of Apple Inc. For the fixed asset turnover ratio calculation of the fiscal year ended on September 29, 2018. As per the annual report, the following information is available:

Based on the above information the Fixed Assets Turnover Ratio calculation for Apple Inc.will be as follows
As per the question,
Net fixed asset for 2017 = Gross fixed assets (2017) – Accumulated depreciation (2017)

Net fixed asset for 2018 = Gross fixed assets (2018) – Accumulated depreciation (2018)

Average net fixed asset = [Net fixed assets (2017) + Net fixed assets (2018)] /2

Fixed asset turnover ratio for Apple Inc. = Net sales / Average net fixed assets

Therefore, Apple Inc. generates a sales revenue of $7.07 for each dollar invested in fixed assets during 2018.
Fixed Asset Turnover Ratio Formula Calculator
You can use the following Fixed Asset Turnover Ratio Formula calculator
| Net Sales | |
| Average Net Fixed Assets | |
| Fixed Asset Turnover Ratio Formula | |
| Fixed Asset Turnover Ratio Formula = |
|
|
Relevance and Uses of Fixed Asset Turnover Ratio Formula
- The fixed asset turnover ratio is an important formula from the point of view of an investor and creditor who use this formula to assess how well a company is utilizing its machines and equipment to generate sales. This concept is important for investors because it can be used to measure the approximate return on their investment in fixed assets.
- On the other hand, the creditors use the ratio to check if the company has the potential to generate adequate cash flow from the newly purchased equipment in order to pay back the loan that has been used to purchase it. This ratio is typically useful in the case of the manufacturing industry where companies have large and expensive equipment purchases.
- However, the senior management of any company seldom uses this ratio because they have insider information about sales figures, equipment purchases and other such details which are not readily available to outsiders. The management prefers to measure the return on their purchases based on more detailed and specific information.
- If the company has too much invested in the company’s assets, then their operating capital will be too high. Otherwise, if the company does not have enough invested in its assets, then the company might end up losing sales which will hurt its profitability, free cash flow and eventually stock price. As such, it is important for the management to determine the right amount of investment in each of their assets.
- It can be done by comparing the ratio of the company to that of other companies in the same industry and analyze how much others have invested in similar assets. Further, the company can also track how much they have invested in each asset every year and draw a pattern to check the year-on-year trend.
Recommended Articles
This has been a guide to Fixed Asset Turnover Ratio Formula. Here we discuss how to calculate Fixed Asset Turnover Ratio step by step using practical examples and downloadable excel template. You can learn more about financial analysis from the following articles –
- Examples of FCF from EBITDA
- Types of Financial Ratios
- Calculate the Solvency Ratio Formula
- What is Net Fixed Assets?
- Accumulated Depreciation Formula
- Financial Ratios List
- Equity Turnover Ratio Calculations
- Operating Expense Ratio Calculations
- Solvency Ratios Calculations
The post Fixed Asset Turnover Ratio Formula appeared first on .